
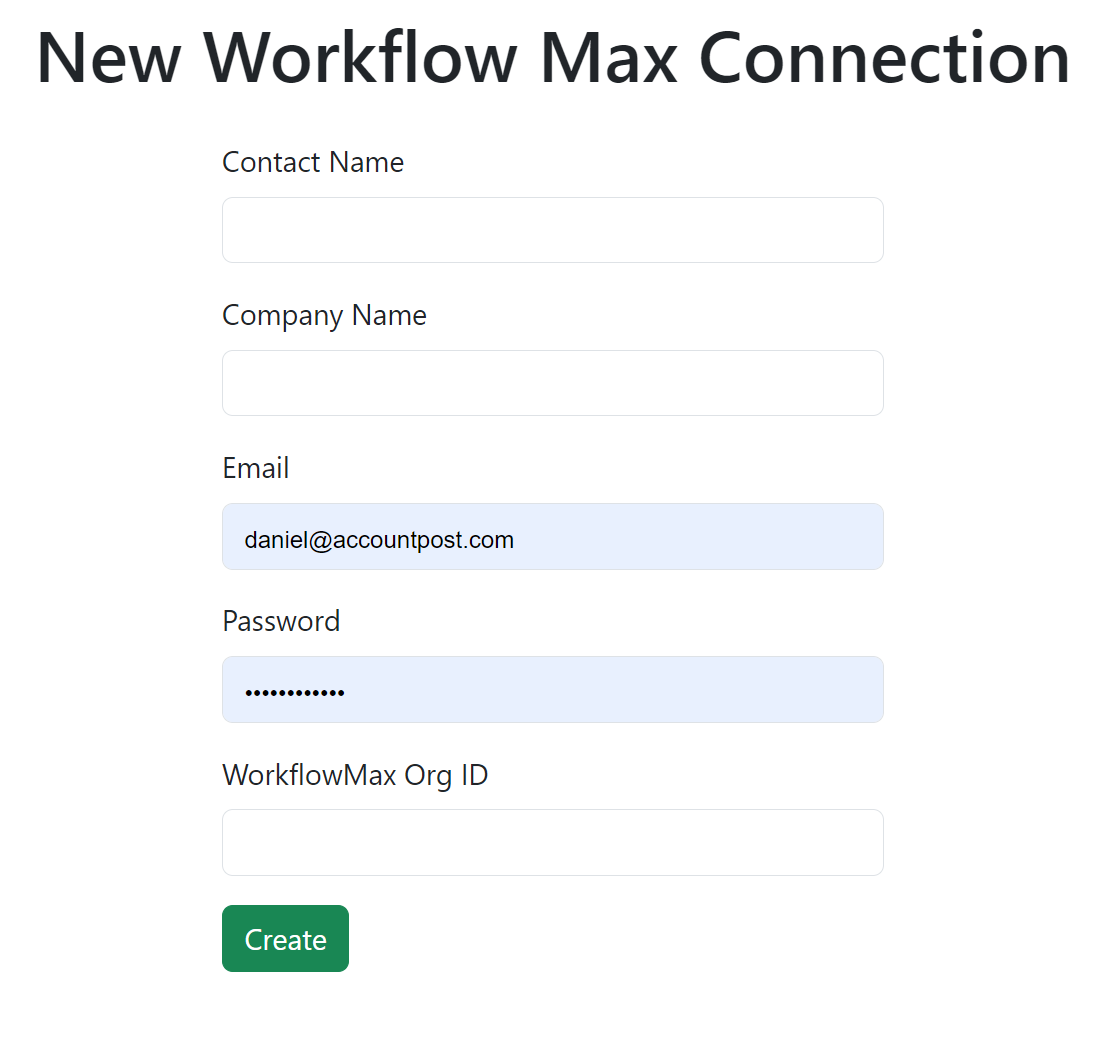
When a new user accesses the ResponseDataIO API Connector, they are presented with the New Connection form. This form requires the following information:
The user can also choose to Log In if they already have an existing connection.

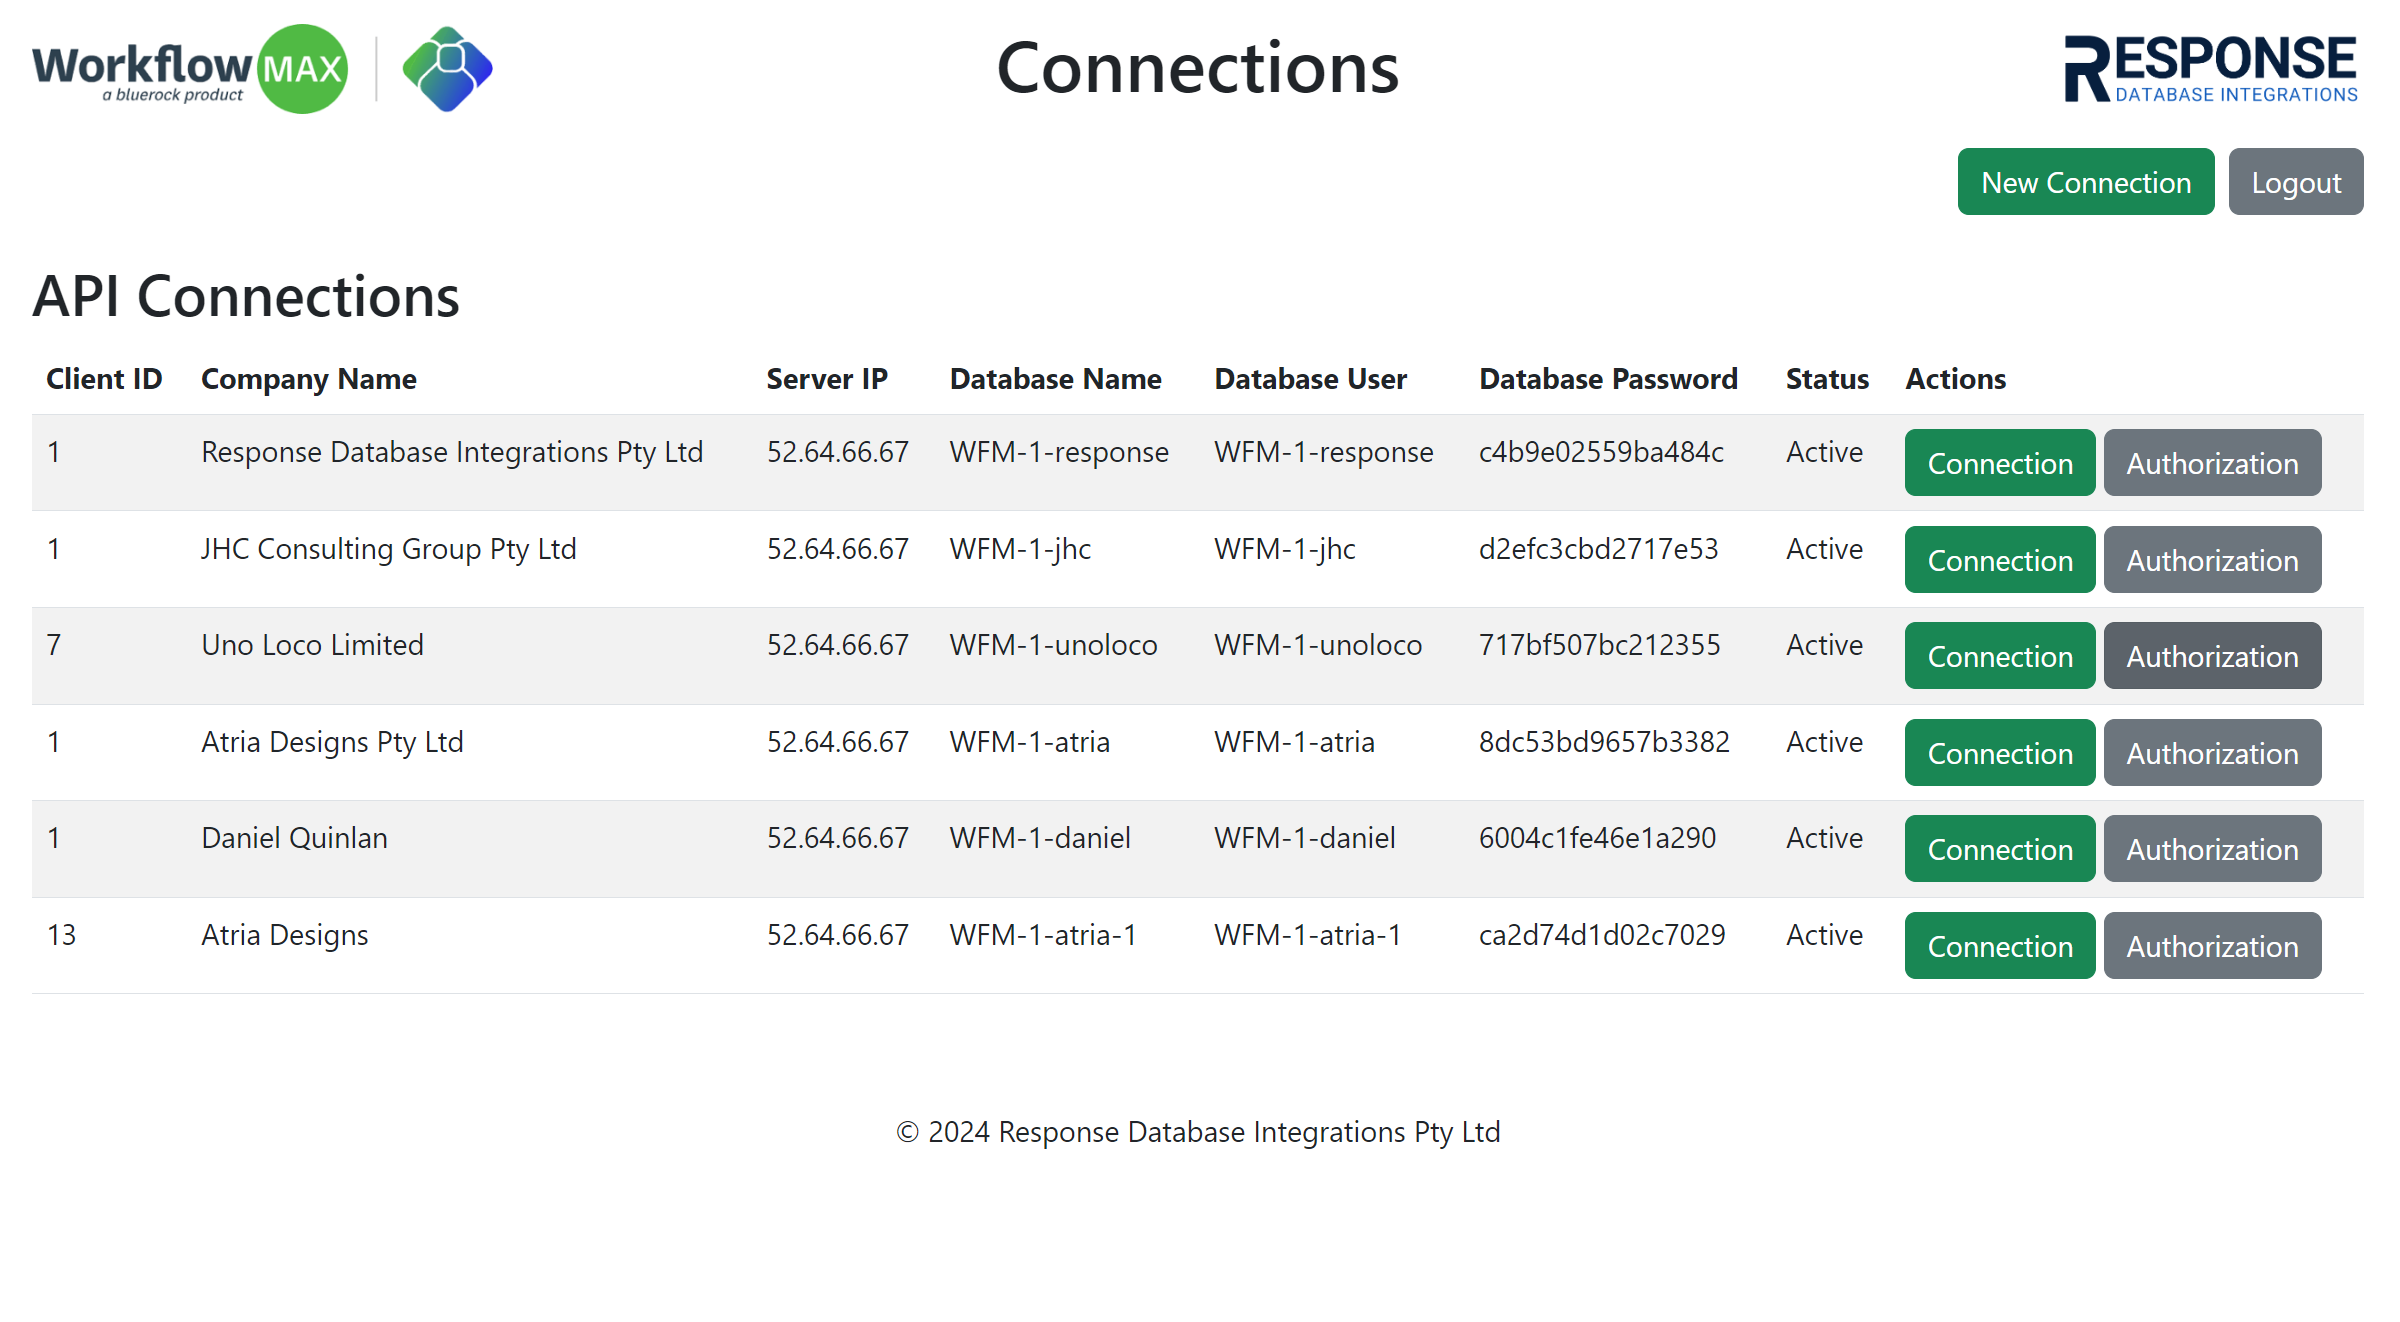
After logging in, the user is directed to the Connections screen, where a list of existing connections is displayed. The user can select an existing connection, which leads to the Connection Page.
If the user has just created a New Connection, the WorkflowMax 2 Authorization screen is presented. Once authorized, the user is redirected to the Connection Page.
The Connection Page is the heart of the ResponseDataIO app. It provides the following key features:

Screenshot: Summaries Tab

Screenshot: Charts Tab

Screenshot: Tables Tab

Screenshot: Query Tab
The Summaries tab provides detailed tables displaying job and timesheet data. The data is categorized by job status and client, allowing the user to easily view project progress and work done for each client.
The Charts tab visualizes important financial data, such as invoices and timesheets. The bar charts show the number of invoices per month and differentiate between billable and non-billable timesheets for each month.
The Tables tab allows users to view the database tables directly. They can select a table from a dropdown menu to see the contents. There is also an option to download the table data in CSV format for offline analysis.
The Query tab provides a SQL query interface where users can input and run SQL queries directly on their WorkflowMax 2 data. Users can also download the query results as a CSV file for further analysis.